

Version5.0.0
Lua Editor and Debugger
A preset can carry a Lua script, a small program that runs on the controller together with the preset. The script can format values, react to MIDI messages, read patch dumps, draw its own controls, sequence notes and much more. This page describes the tools the editor gives you for it: the Lua tab to write the script and watch its output, and the Debugger to stop the script on the controller and look inside while it runs.
What the script can do is described in the Preset Lua Extension reference. If you are new to Lua, the MIDI and Lua course starts from the beginning.
The Lua tab
The Lua tab is available in Basic and Expert mode.
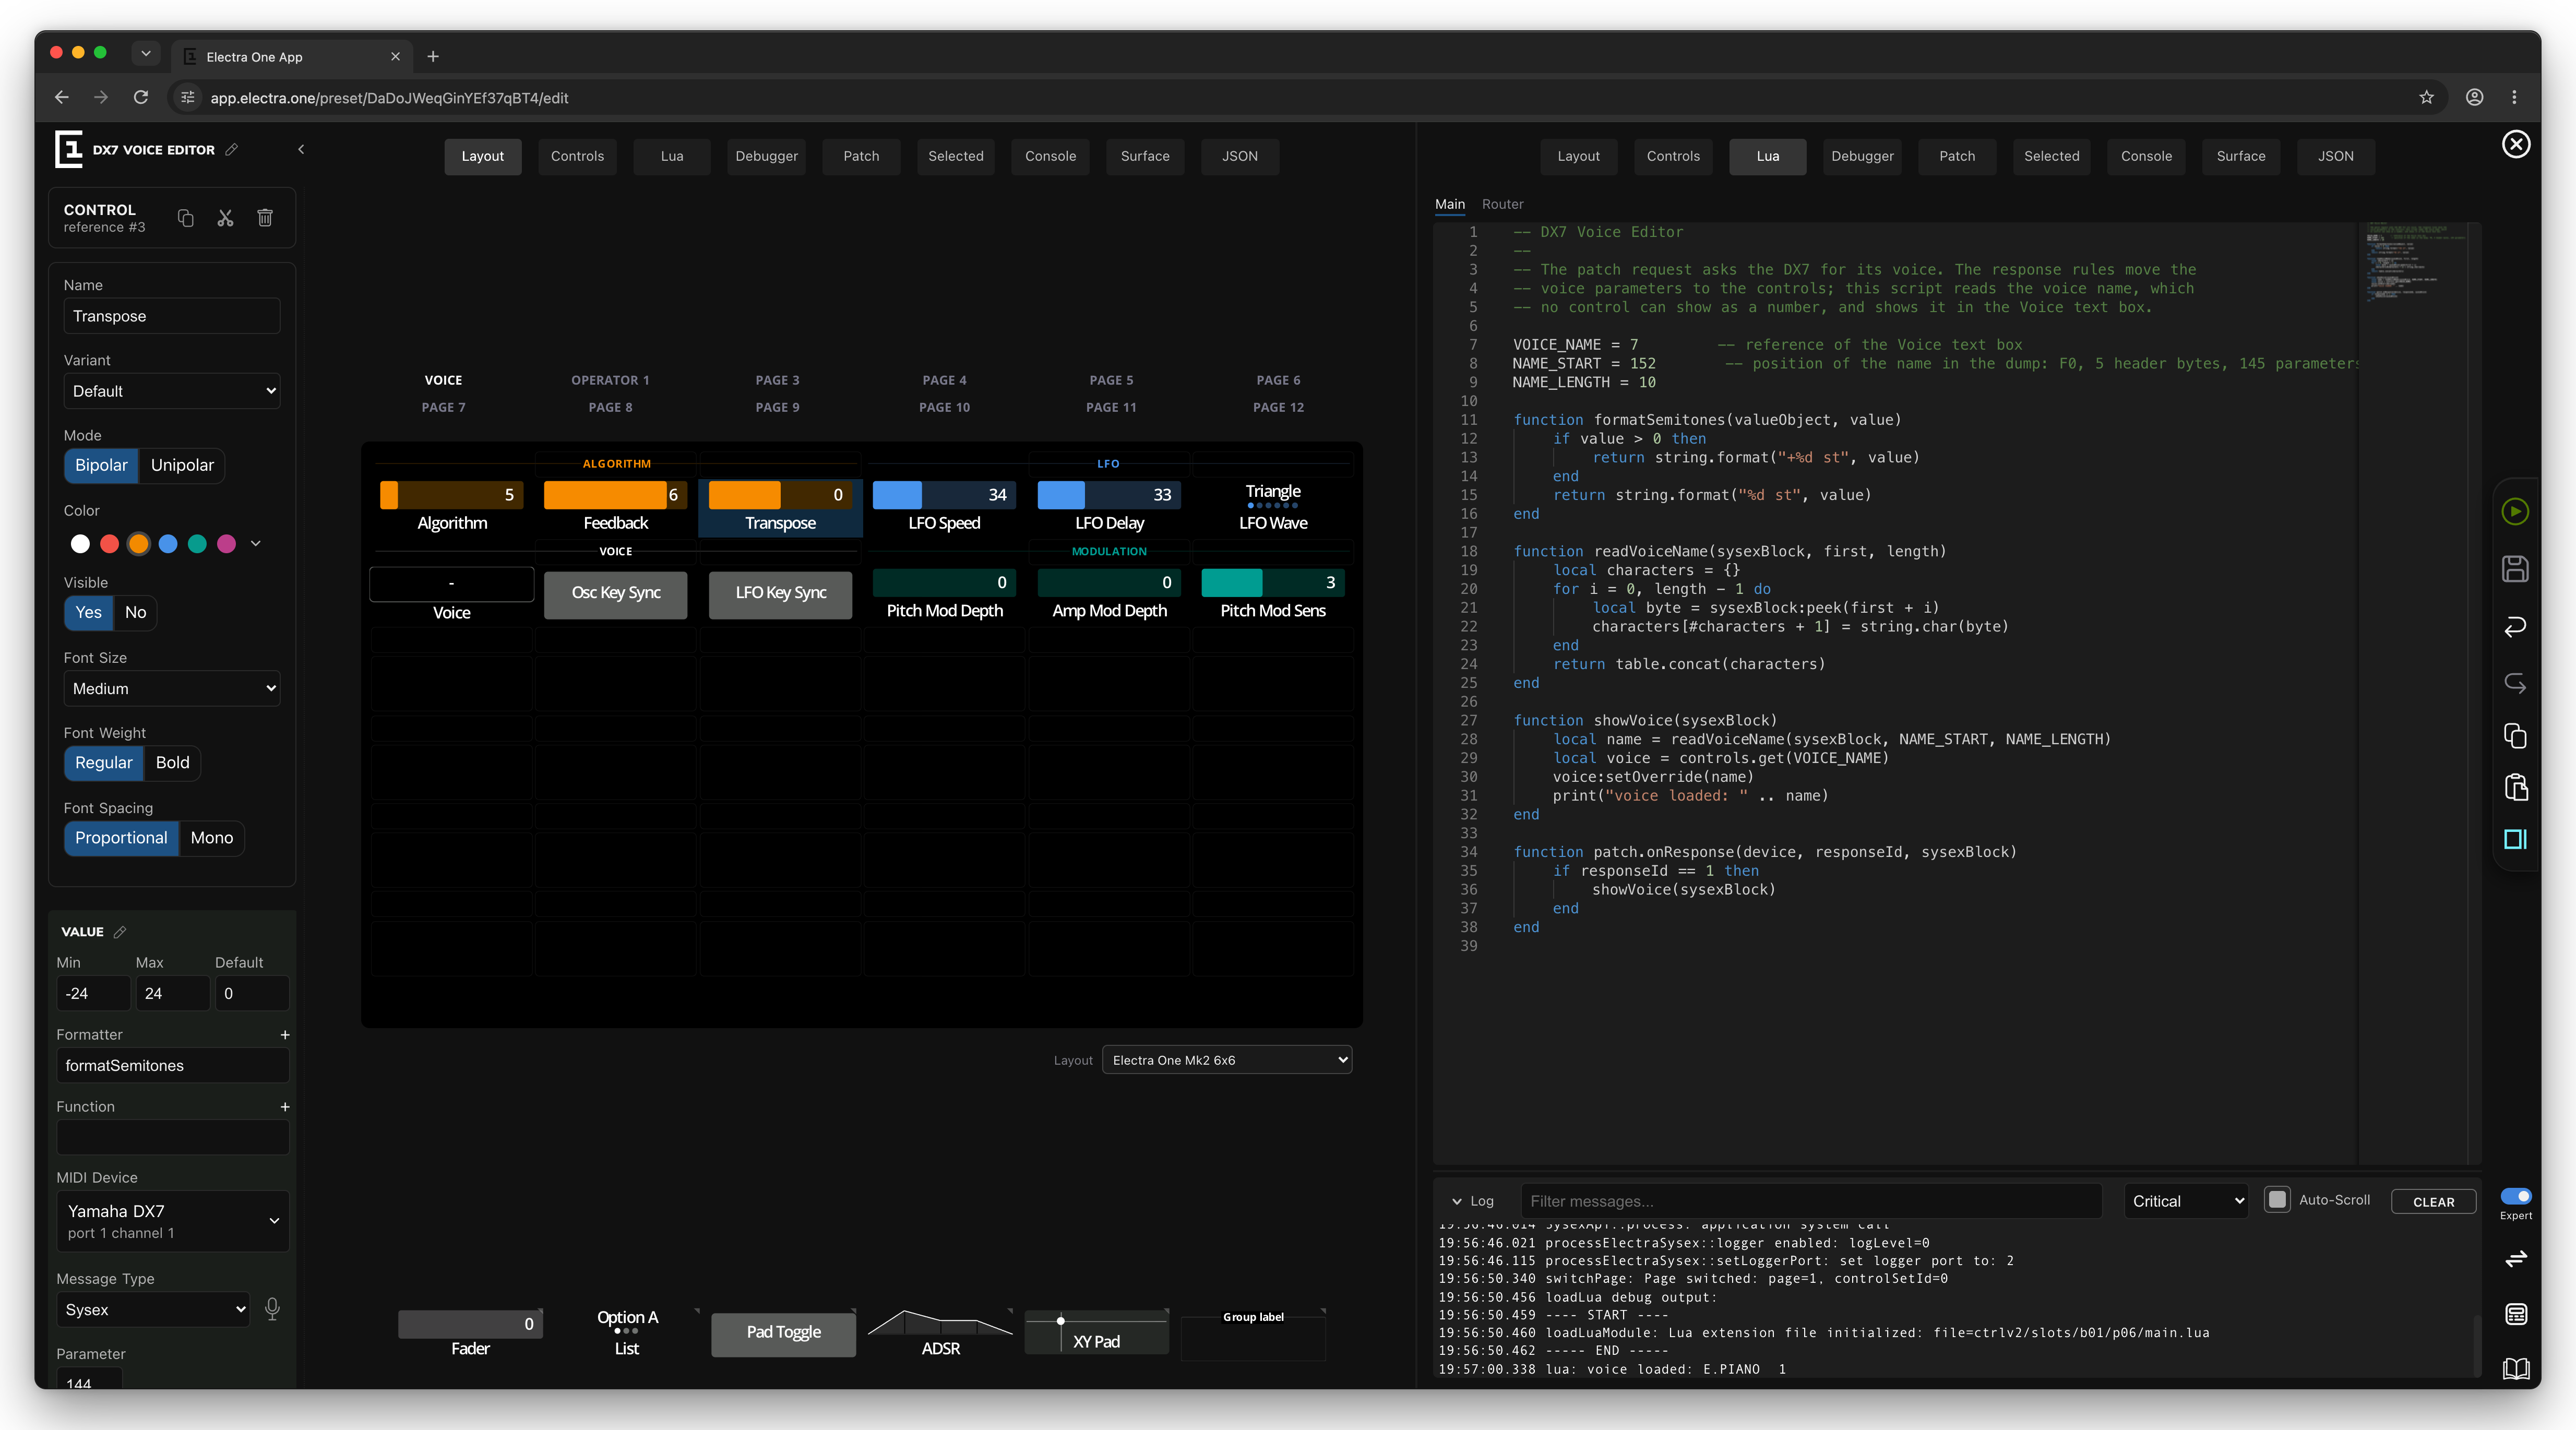
At the top, tabs choose the file:
- Main is the preset's script,
main.lua. It is loaded with the preset. - Router is the preset's router script,
router.lua, which works on the MIDI messages passing through the router. - Preset tests and Router tests hold the preset's test files,
main-tests.luaandrouter-tests.lua. They are saved with the project and are never stored on the controller: the Run button on these tabs sends the file to the controller, which runs it against the preset on the screen and answers with the result, shown under the editor in place of the log. See Lua tests.
The editor is the same one used by Visual Studio Code:
- syntax colouring, and a minimap of the whole script on the right,
- F1, or right-click and Command Palette, lists every command with its shortcut: find and replace, go to line, comment lines, fold blocks, add cursors and so on,
- completions for the Electra One Lua API, see below.
The script is part of the project. It is saved with the project, Undo reverts changes to it, and Send to Electra sends it to the controller together with the preset. There is no separate upload: edit, then send.
Drag the bar between the script and the log to share the height.
Completions
While you type, the editor offers the functions of the Electra One Lua API, with their parameters and a short description:
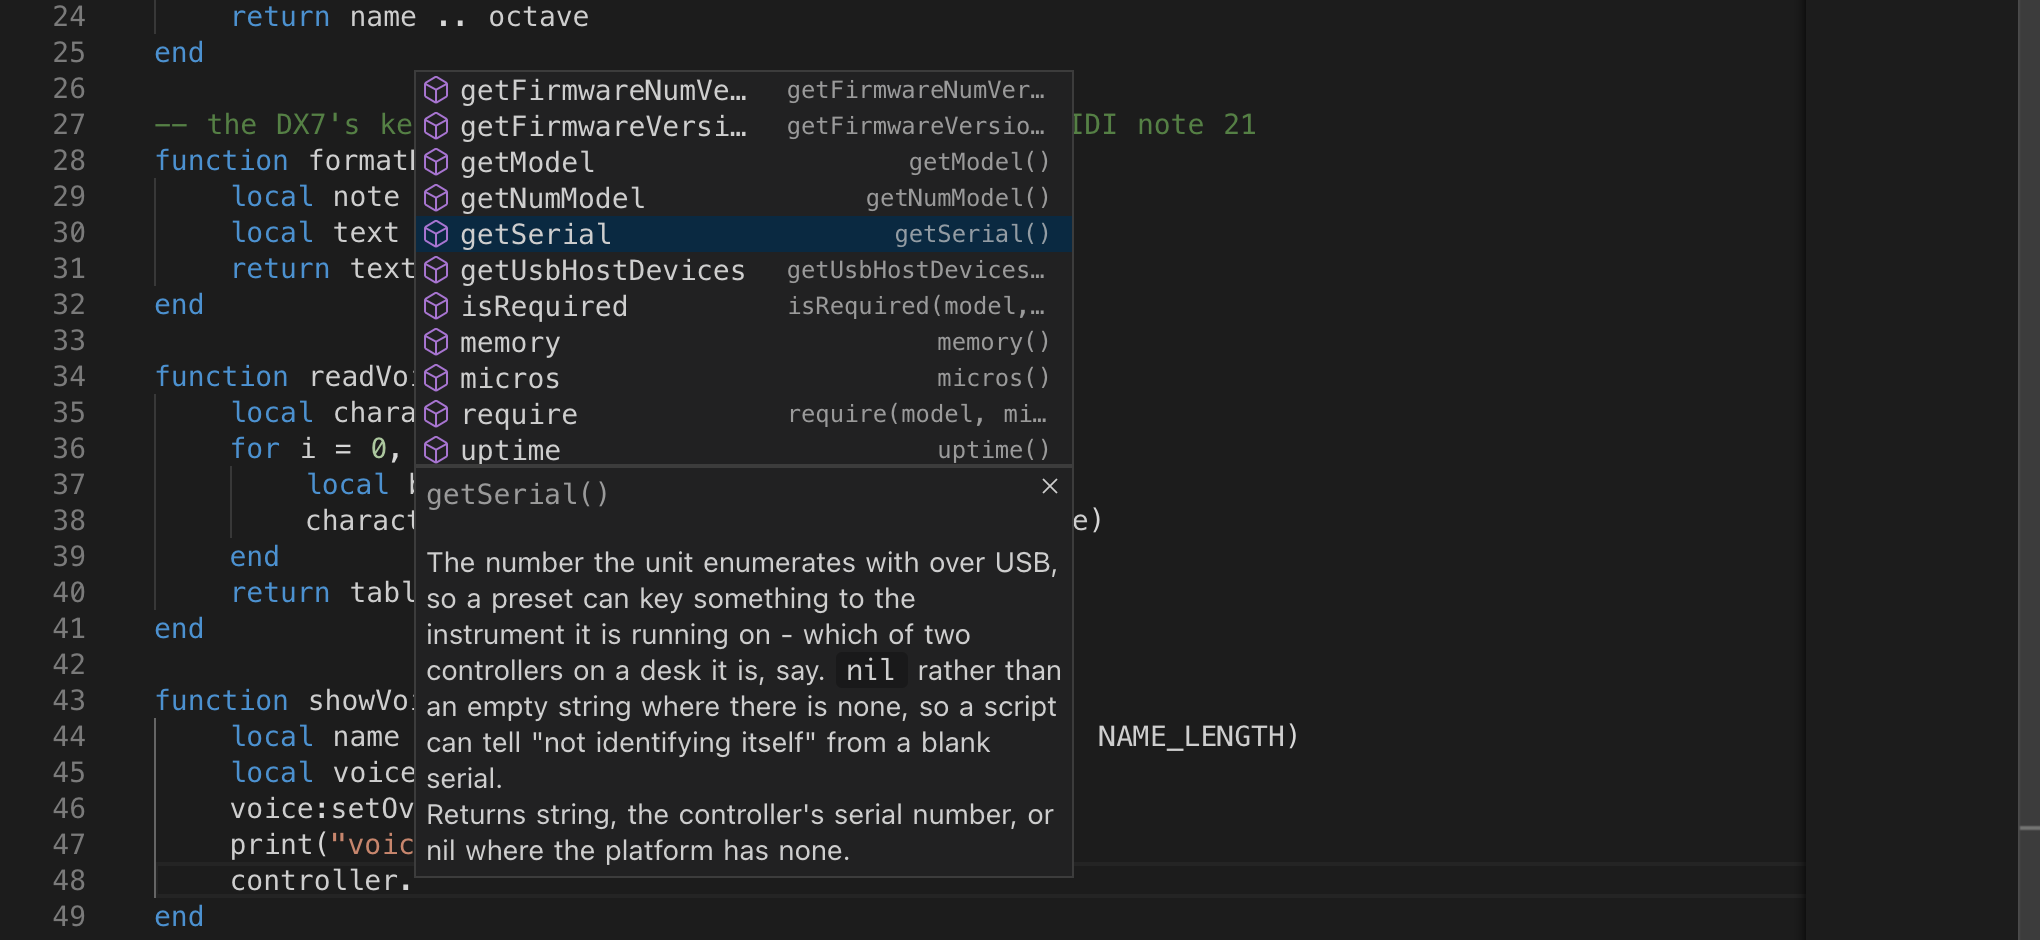
- After a library name and a dot, such as
controller.ormidi., it offers the functions of that library. - After an object and a colon, such as
control:, it offers the object's methods. - Choosing a function inserts it with its parameters, ready to fill in; Tab moves to the next parameter.
- After
function patch.orfunction midi., it offers the callbacks the controller calls, and inserts the whole function definition. - Press Ctrl Space to show or hide the description of the selected function. Pointing at a function name in the script shows its description too.
The completions are generated from the firmware's function tables and the developer documentation when the editor is built. The Router script gets the completions of the router API.
⌘ S (save) and ⌘ ⇧ S (Send to Electra) work while you type in the script. ⌘ Z there undoes your typing.
The + buttons
In the settings of a control, the Formatter and Function fields have a + next to them (Expert). Type a function name and click +: an empty function of that name, with the right parameters, is added to the end of the Main script. Event actions of the type Lua function have the same button.
The log
Under the script, the log shows the messages the controller reports: what it loads, errors in the script, and everything the script prints with print().
- Log folds the log away to a single line with the latest message, and opens it again.
- Filter messages... shows only the lines that contain the text.
- The level selector sets how much the controller reports: Disabled, Critical, Warning, Info or Trace.
print()output is shown at every level except Disabled. - Auto-scroll keeps the newest line in view.
- CLEAR empties the log.
The browser remembers the level for the next time.
The log keeps the last 500 lines, each with the time it arrived. Errors in the script are shown here, with the line they happened on: when a function doesn't do what you expect, look at the log first.
The debugger
Expert. The debugger stops the preset's script on the controller, at a line you choose, while the preset is running and the instrument is playing. At that moment you can see which functions were called to get there, the value of every variable, and the state of the controller's threads, and you can evaluate Lua expressions in the stopped function. Then you step through the script line by line, or let it run on.
This is what developers expect from their tools on a computer. On a MIDI controller it is unusual: the script is not simulated in the browser, it is the real script, on the real hardware, with the real MIDI data.
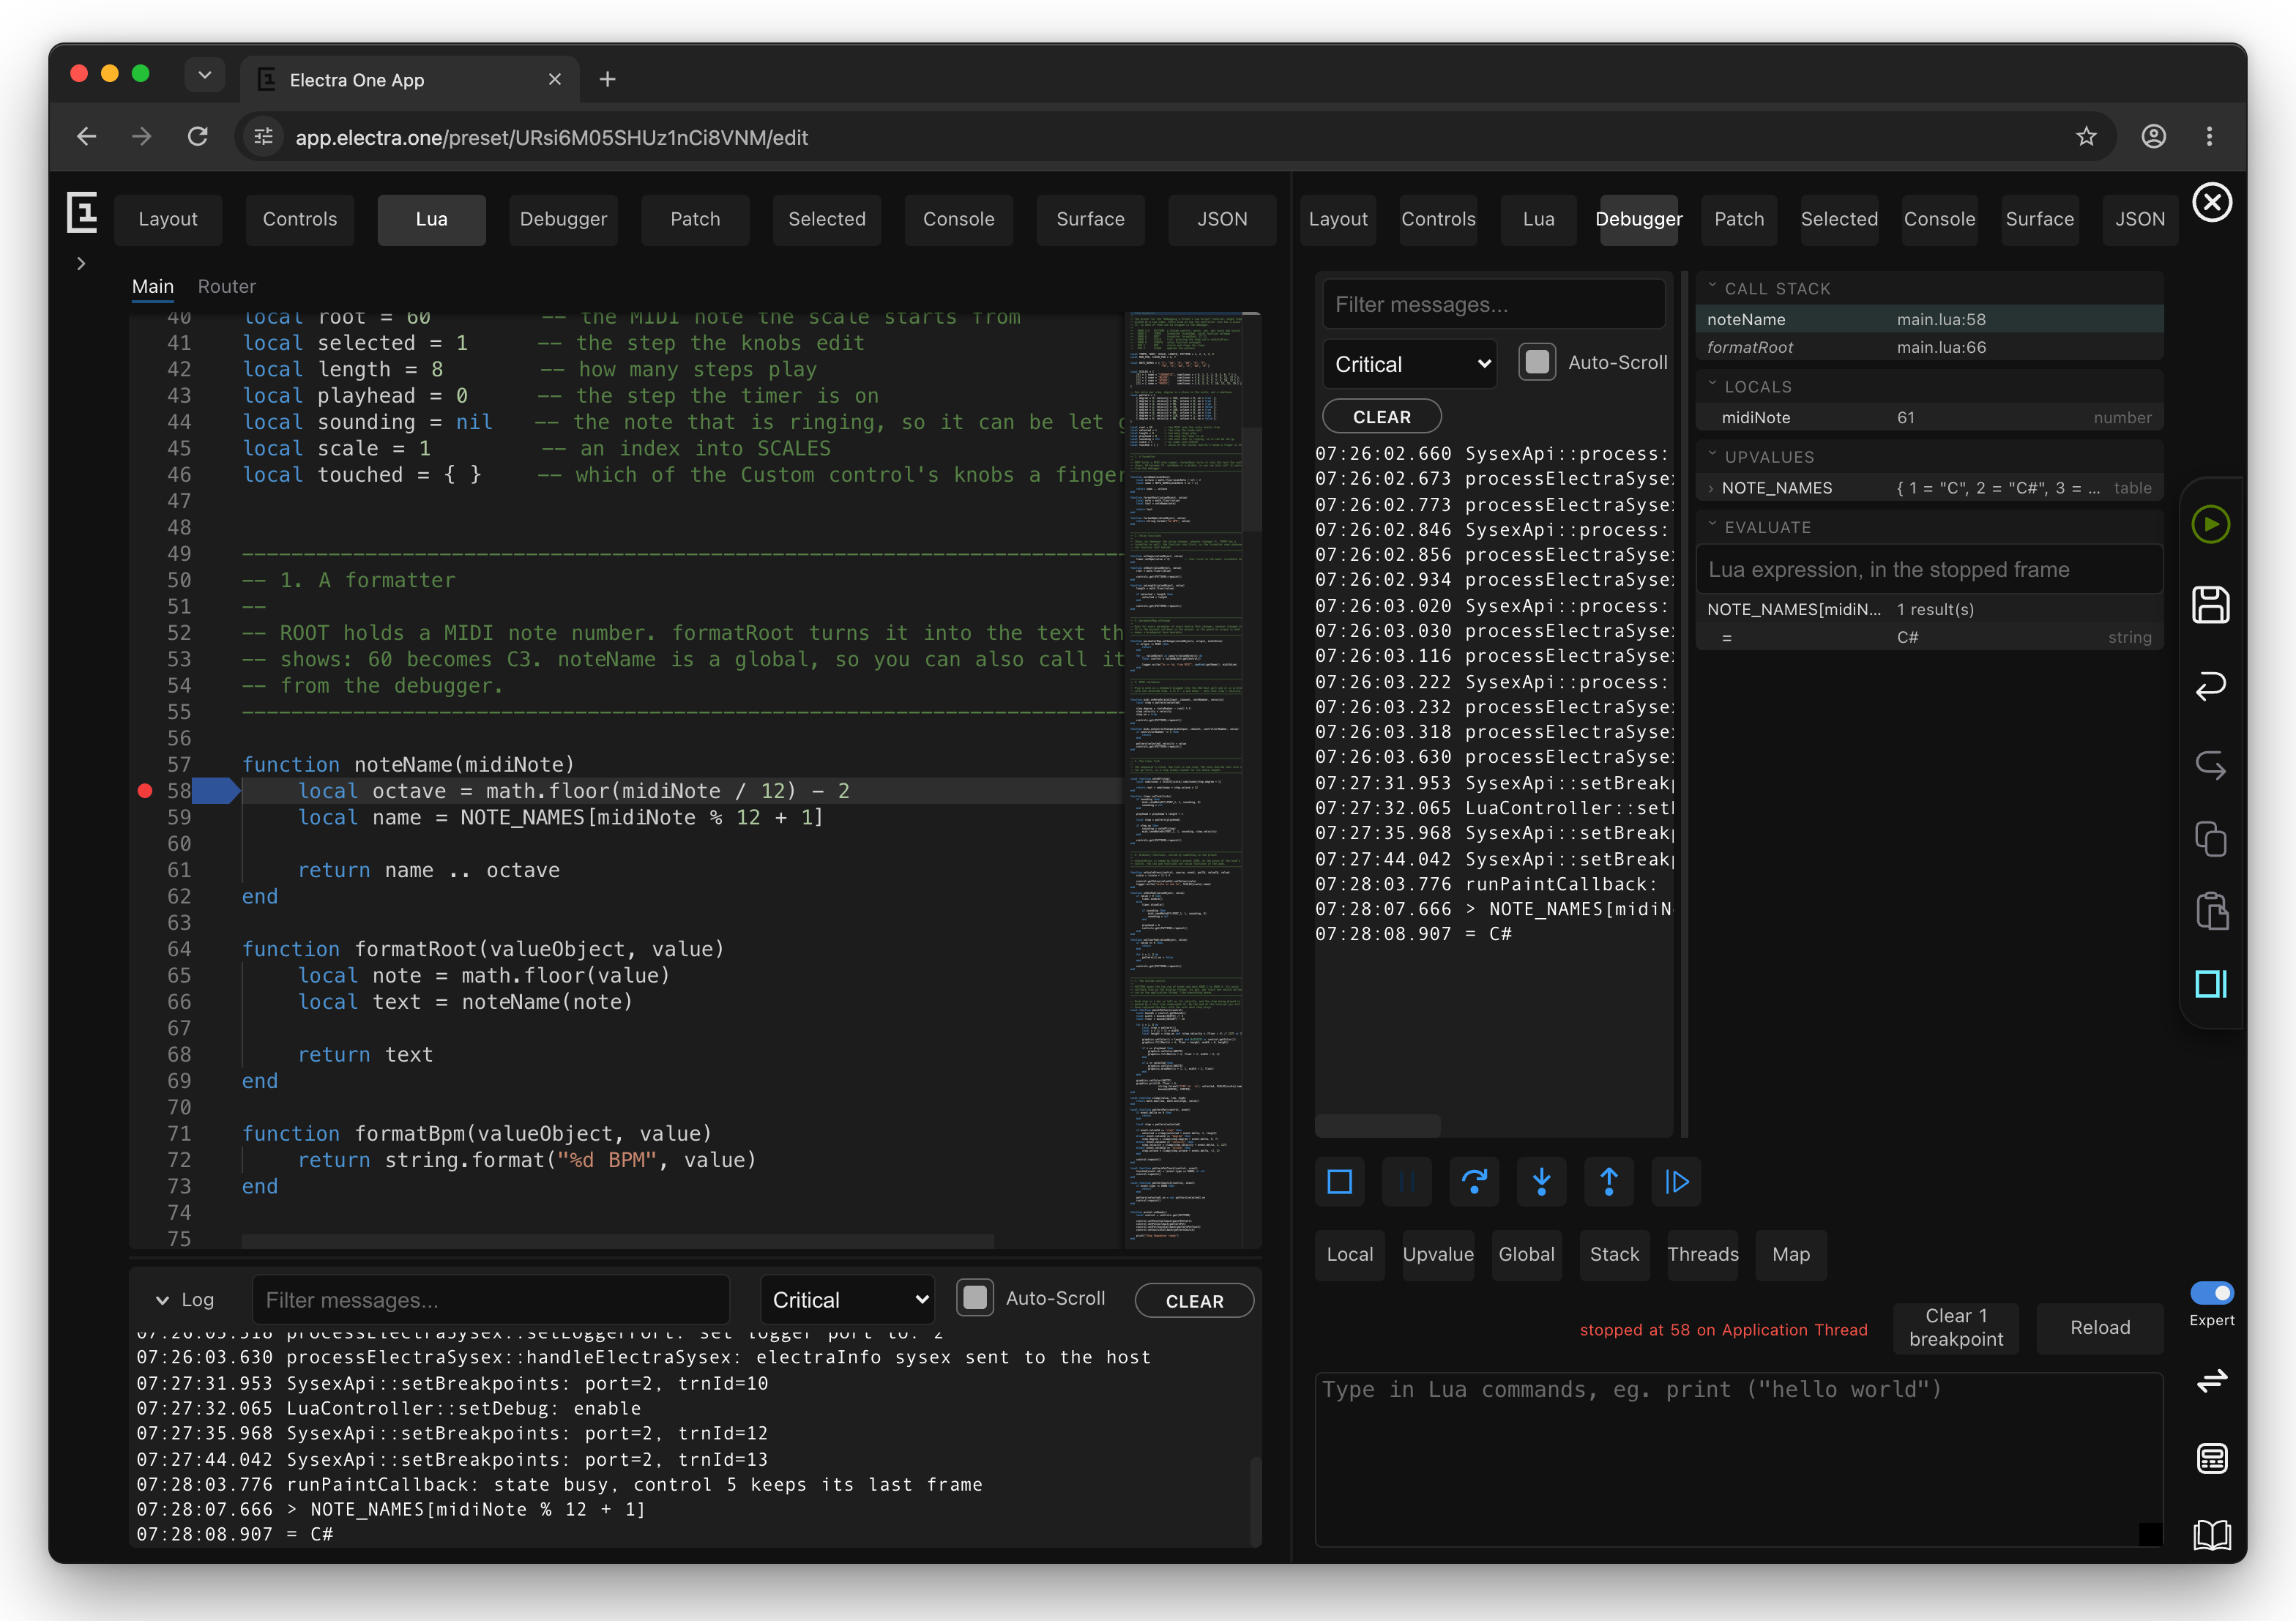
This page describes what each part does. For a walk through a real session, step by step, see How to Debug a Preset's Lua Script.
A session
A session is the time between Attach and Detach. Breakpoints only stop the script while one is open, and the debugger attaches to the preset the controller has on screen rather than to the one the editor is showing - it follows the instrument.
The Lua tab and the Debugger tab are separate tabs, so a split view with one on each side is what makes a session workable: the script on one side with the stopped line highlighted, the variables on the other.
While a session is open the controller says so. A bug icon appears in the bottom bar, with a word beside it for what the script is doing: RUNNING, or a red STOPPED while it waits at a breakpoint. A stopped script looks exactly like a hung controller from the front, which is what the word is there for.

A session survives a great deal. Sending the preset again, reloading it, or switching to another preset on the controller does not end it - the debugger follows, and sends the breakpoints again. Closing the editor does end it, and leaves the controller attached with nothing driving it; Detach first.
Breakpoints
- Click a line number in the Main script to set or remove one. The Router script cannot be debugged.
- A breakpoint also stops at the same line of any module the script loads with
require. - A preset can have up to 32. They are sent to the controller as you set them, and again when you attach or send the preset.
- They are remembered per preset: reload the editor and they are still on the lines you left them, and already back on the controller.
- A breakpoint is a line number. If you add or remove lines above it, move the breakpoint too, and send the preset so the controller runs the same lines.
- Clear N breakpoints removes them all, in the editor and on the controller.
- A breakpoint on a line that never runs, such as the
endof a function that returns earlier, never stops.
Start-up can be stopped too
The hook is installed before the script runs, so a breakpoint in the main chunk or in preset.onLoad, onReady or onEnter stops there like any other. Those lines run only as a preset starts, which is what Reload is for: it starts the script again with the session still attached.
The toolbar
| Button | What it does |
|---|---|
| Attach / Detach | Starts and ends the session. While attached, breakpoints stop the script. |
| Pause at the next line | Stops at the next line the script runs, wherever that is. |
| Step over | Runs the current line, including anything it calls, and stops at the next. |
| Step in | Runs to the next line, stepping into a function the current line calls. |
| Step out | Runs to the end of the current function and stops in the one that called it. In a function the controller called directly, it continues. |
| Continue | Runs on until the next breakpoint. |
| Local, Upvalue, Global | Show the selected frame's locals or upvalues, or the script's own globals. |
| Stack, Threads, Map | Re-read the call stack; list the controller's threads; show the parameter map. |
| Clear N breakpoints | Removes them all. |
| Reload | Reloads the preset on the controller. The session stays attached, and the script is followed from its first line. |
The status beside the buttons says what the debugger is doing: detached, attached and running, stopped at a line on a thread, or waiting for a preset with a script.

The inspector
The inspector is the column beside the log. Drag its left edge to widen it, and click any panel's header to fold it away - a stop can put up seven panels at once. Both are remembered.
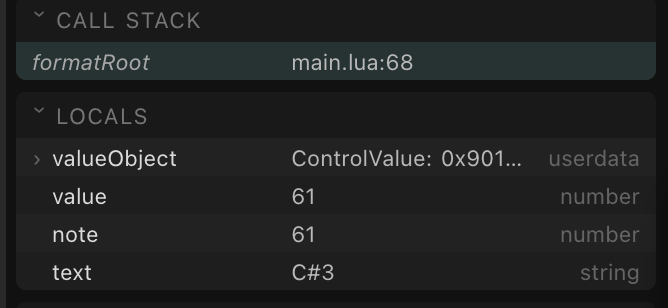
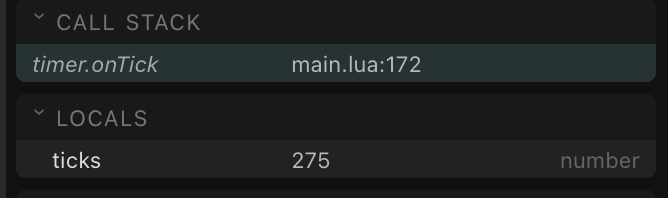
- CALL STACK: the functions that led to the stopped line, innermost first. Click a frame to see its variables; the evaluation then runs in that frame too. A function the controller called itself has no name of its own in Lua, so the editor reads it out of your script and shows it in italics.
- LOCALS: the local variables of the selected frame. A variable declared later in the function is not listed at all - it does not exist yet.
- UPVALUES: variables of enclosing functions the frame uses, which for a preset usually means the script's own top-level locals.
- GLOBALS: the script's own globals. The Lua and Electra One built-ins are left out; the heading says how many.
- THREADS: every thread with its state, priority and how much of its stack it has used. STOPPED marks the thread the script is stopped on, CMDS the one carrying the debugger's commands.
- EVALUATE: the result of the last expression you ran.
Tables and objects
A table shows its first few entries rather than an address, and has a › that opens the whole of it. Click a field that is itself a table to go deeper.
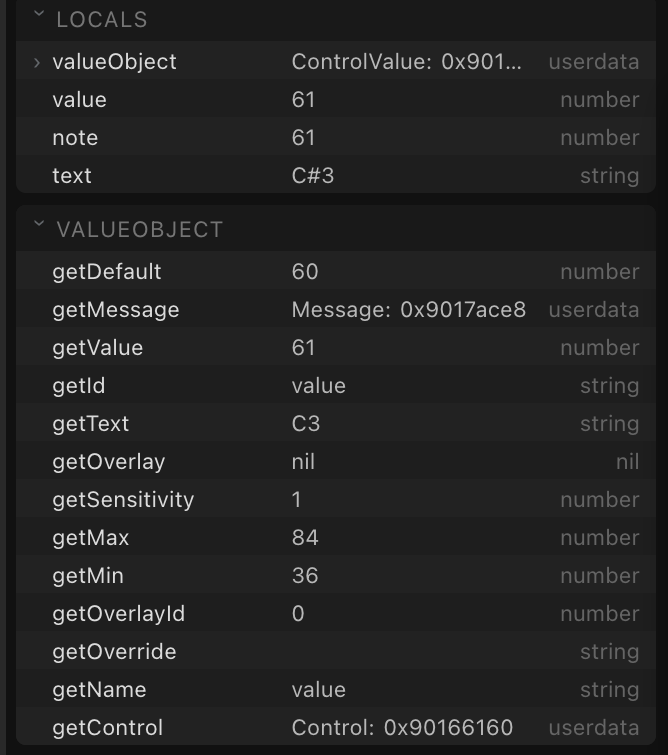
An object of the script API - a control, a value, a message, a page - says which kind it is and opens as well. What you see depends on the object:
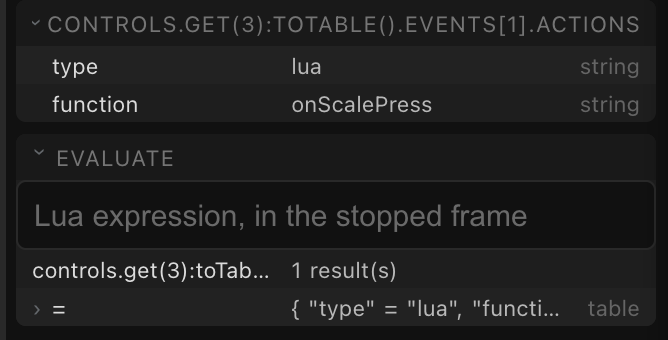
- An object that can describe itself - a control, a page, a group, a device - opens as its own shape, the one its
.eprobject has, and its fields open further. - One that cannot, such as the
valueObjecta formatter is given, opens as the answers of itsgetfunctions. Those are the end of the line.
Named constants
The script API hands out its enums as plain integers, and a bare 0 says nothing - 0 is MIDI_IO, and PORT_1, and INTERNAL. Where the debugger can tell which family a value belongs to, it writes the name beside the number:
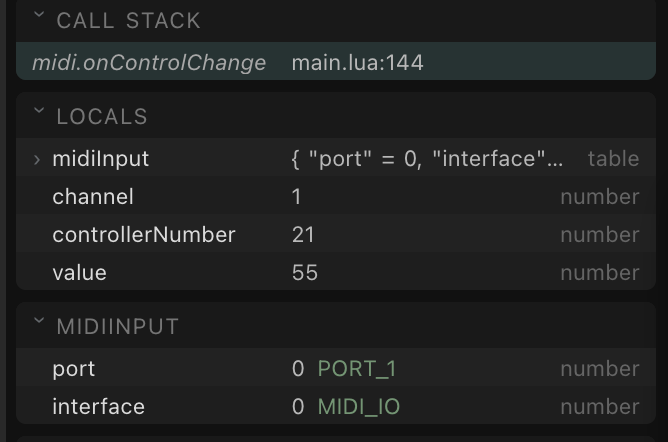
The name is a reading of the value, never a replacement for it. A value the debugger cannot place keeps its plain number.
What stops, and what keeps running
The controller runs the script from several threads, and a breakpoint stops only the thread that reached it:
| Thread | Runs | While it is stopped |
|---|---|---|
| Application Thread | timers, formatters, value functions, knob and touch handlers, and all midi.on… callbacks | the screen and the knobs don't respond; MIDI keeps flowing through the router |
| Lcd Thread | functions that draw custom controls | the custom control keeps the picture it had; the rest of the screen is still drawn |
| MIDI Thread | patch.onResponse | cannot be stopped |
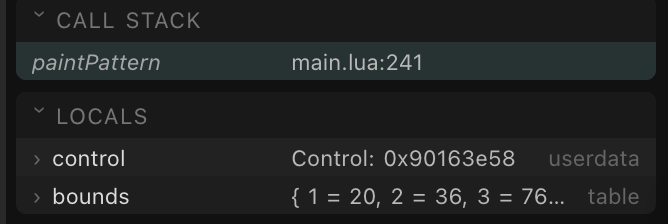
The MIDI thread also carries the debugger's commands, so stopping it would stop the debugger itself. A breakpoint there is reported in a red box, "cannot stop the MIDI Thread", and the script runs on. To debug patch.onResponse, move the work you want to inspect into a function that runs on the application thread, or use print().
Whichever thread is stopped, none of that preset's script runs anywhere else while it is. A thread that wants to enter a stopped script is turned away rather than made to wait, so the work is skipped and not queued: a knob turned while a paint callback is stopped does nothing at all, and the turn is gone rather than waiting to be delivered. After continuing, the debugger says how many calls were given up.
That is why stopping in a paint callback still leaves the knobs dead, even though the thread that reads them is running: their handlers are the same script. Other presets are a different matter - their scripts are different states, and they are not stopped.
A step that runs past the end of a callback stays armed, and stops at the next line the script runs, for example at the next timer tick. A timer says how far it has fallen behind while you were reading: ticks is not a counter but how many periods the call stands for.
When the preset is reloaded, sent again, or another preset is opened on the controller, the debugger follows the preset on screen and sends the breakpoints again.
The command line
Under the debugger, the box runs Lua in the preset's script: type a line and press Enter; Shift Enter adds another. Which way it runs is chosen for you - evaluated in the stopped frame when the script is stopped, with that frame's locals and upvalues in scope, and executed when it is running.
Both echo into the log, so one place reads as a session:
> valueObject:getText()
= C#3
> is what you typed and = what came back. A result that is a table or an object also appears as a row in the inspector, where it can be opened; a line of text in the log cannot be.
clear empties the log.